Appearance
Binding Live Data to Pages
Once you've set up a Data Source, the next step is showing its values on a page. There are two ways to do that in the Page Editor:
- Text layers — type
/inside any text layer to insert one or more live fields, time, weather, or context values. - Groups — bind a group of layers to a list (an array), so the layout repeats once for every item (e.g. five upcoming events, one row each).
The idea in one minute
A data source holds structured data — usually a JSON object with fields and arrays. Binding is how you point a layer on your page at a specific piece of that data.
- A text layer can mix static text with one or more binding chips. Example:
Welcome, {firstName}!where{firstName}is a chip that resolves live. - A group layer is a container that repeats its children over an array. Example: a row for every train in a departures list.
You never type syntax by hand. Inside any text layer, hit / to open the slash menu, drill into the data, and pick the field you want. Lumicast handles the rest.
Binding a text layer
There are two ways to open the slash menu inside a text layer:
- Type
/anywhere in the text. The menu opens at the cursor. - Click
Add dynamic datain the right panel's Dynamic data section. Lumicast enters the text layer for you and opens the menu at the end of the existing text.
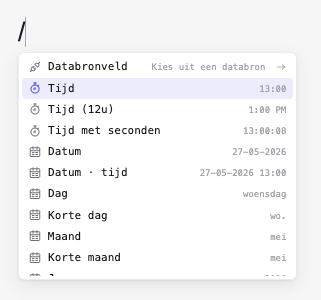
The menu lists everything you can drop into the text:
| Category | What's in it |
|---|---|
| Datasource field | Drills into any data source in this workspace, then into its JSON tree. |
| Group field | Only visible when the layer sits inside a bound group — drills into the current row's fields. |
| Time / Date | Time, 12-hour time, time with seconds, date, date + time, day name, short day, month, short month, year. Previews show the live value. |
| Weather | Temperature, feels-like, conditions, wind, humidity, sunrise, sunset, UV index. Resolved from the display's location. |
| Group context | Row index, cycle page, cycle total. Only inside a bound group. |
| Context | Display name, workspace name, organisation name. |
Pick a leaf and Lumicast inserts a chip at the cursor position. The chip resolves to the live value on the canvas and on screen. Static text around the chip stays plain text — you can type before, after, or between chips, and you can mix as many chips as you want into one text layer.
Filtering and keyboard navigation
While the menu is open, typing filters the visible items. ↑ / ↓ move the selection; Enter picks; Backspace (on an empty filter) goes back one step; Esc closes the menu and leaves your typed text alone.
Editing or removing a chip
Click any chip to open its bubble menu:
What you see in the bubble depends on the chip:
- Datasource chips — show the datasource name and field path, with an Edit button that reopens the slash menu starting from the chip's parent path. Pick a sibling field to swap, drill deeper, or use Back to go to the root and pick a different datasource entirely.
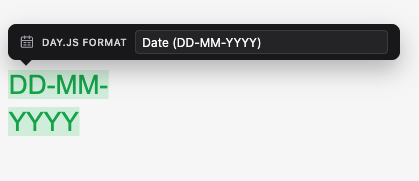
- Date / time chips — pick a preset format (
HH:mm,DD-MM-YYYY, relative, …) or switch to Custom and type your own Day.js format string. - Weather temperature / feels-like — toggle between °C, °F, and K.
- Row index — toggle between 0-based and 1-based numbering.
- Last updated — pick a format for the datasource's last-fetched timestamp.
- Display / workspace / organisation / cycle page / cycle total — read-only label only.
To remove a chip, select it (click on it) and press Delete or Backspace. Chips are atomic — you can't type inside them.
Styling chips
A chip inherits the font, size, weight, colour, and any other transformers of the text leaf you inserted it into. You can also restyle a chip later: select it and apply font / colour / bold / italic from the right panel as you would with regular text.
Binding an array of strings
Most datasource fields are single values, but some are arrays of strings (e.g. a list of tags). When you pick one, the chip joins the items with , by default.
For arrays of objects (e.g. a list of events), use a Group instead — one chip can't show many rows of object data.
Formatting the value
The right panel's Text section has a Transformers subsection. Transformers apply to the text leaf they're placed on (so they affect plain text and any chip inside it). See Transformers for the full list.
Date and weather temperature chips have their own format / unit controls in the chip bubble menu — you don't usually need a transformer on top.
Binding a group to a list
Use a group when you want to display a list of things — upcoming meetings, train departures, leaderboard rows, menu items.
A group isn't an element you add; it's created by selecting existing layers and grouping them. The workflow is: design one row, group it, bind the group to an array, then point each layer at the right field on the current item.
1. Build one row
Add the layers that make up a single row of your list. For a departures board that's typically a text layer for the time, another for the destination, and maybe one for the platform. Size and style them as you want a single row to look.
2. Group the layers
Select all the layers for that row — shift-click them in the canvas or layers panel — and group them. The group appears as a new parent in the layers panel.
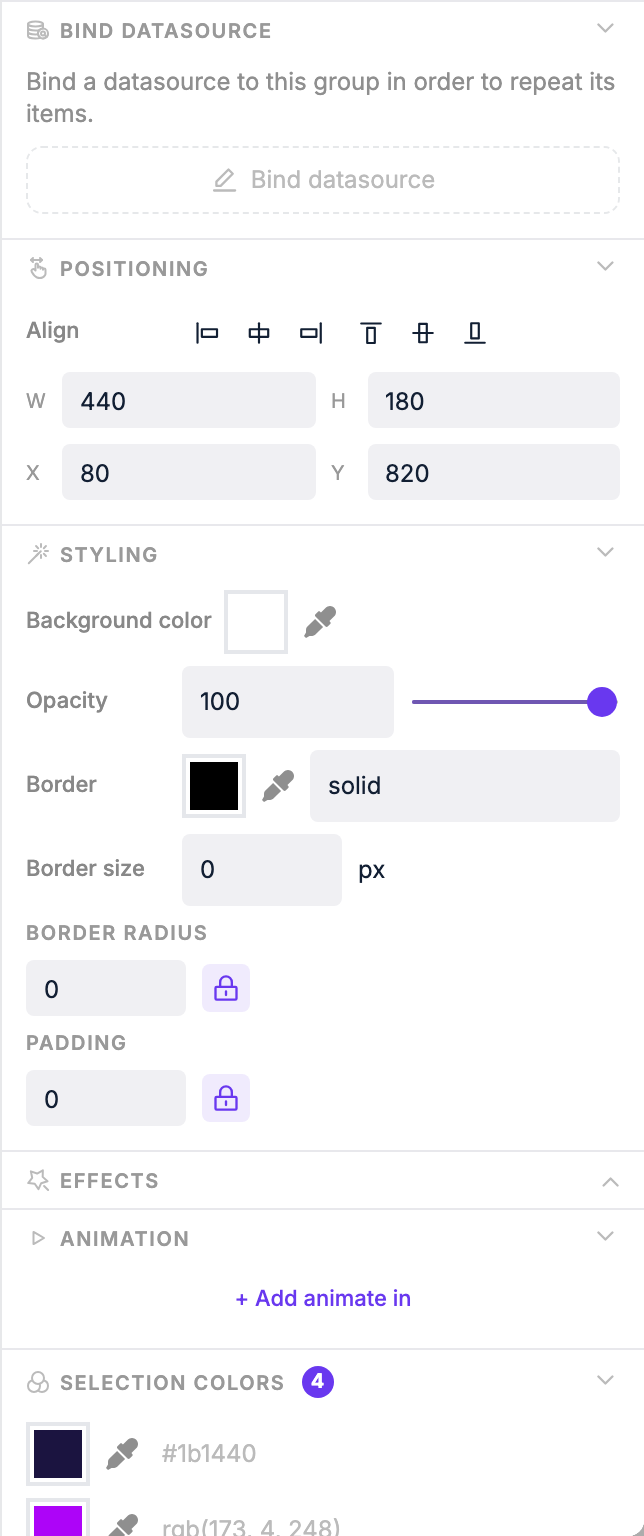
3. Bind the group to an array
- Select the group itself (click it in the layers panel, or its edge in the canvas).
- In the right panel, in the Dynamic data section, click Bind group datasource.
- Pick a data source and select an array in the JSON tree — for example,
departuresin an NS data source. Only arrays and objects are selectable here; you can't bind a group to a single value. - Confirm.
Lumicast now repeats everything inside the group, once per item in that array.
4. Point each layer at the right field
With the group bound, each layer inside it needs to know which field of the current item to show — the time for this row, the destination for this row, etc.
- Click into a text layer inside the group.
- Type
/to open the slash menu. - Pick Group field. The picker opens on the structure of one item of the group's array.
- Choose the field you want (e.g.
time,destination,platform).
Each repeated row automatically gets its own data — you don't number rows or write indexes. If the group is bound to departures and a layer reads destination, each row shows that row's destination.
Datasource field vs. Group field
- Datasource field — picks from a whole data source. Same value on every row. Use for headers, totals, or labels outside the group.
- Group field — picks from the current row's item. Use for anything that should change per row. Only visible when the layer sits inside a bound group.
Controlling how the group repeats
With the group selected, the Repeat Settings control how the list is laid out:
| Setting | What it does |
|---|---|
| Direction | Stack rows vertically or lay them out horizontally |
| Gap | Space between items (px) |
| Items | Maximum number of items to show |
| Skip | Skip the first N items |
| Step | Only show every Nth item (e.g. step 2 shows 1st, 3rd, 5th…) |
| Cycle interval | Rotate through items over time in pages, in seconds |
| Wrap around | When cycling, jump back to the start after the last page |
Cycle interval is useful when you have more items than fit on screen. If a group has room for 5 rows but the data has 30 items, set the cycle interval to (for example) 8 seconds and the group will show items 1–5, then 6–10, then 11–15, and so on.
Group context variables
When a layer sits inside a bound group, three extra chips appear in the slash menu's Group context section:
| Chip | What it shows |
|---|---|
| Row index | The current row's index (toggleable between 0-based and 1-based in the bubble menu) |
| Cycle page | The current page number when Cycle interval is set (1, 2, 3…) |
| Cycle total | The total number of pages when Cycle interval is set |
Typical use of cycle variables: a small label that says Page 2 of 6.
Practical examples
Weather header
A text layer with: It's <conditions> and <temperature> in <city>.
<conditions>— slash menu → Weather → Conditions.<temperature>— slash menu → Weather → Temperature (toggle unit in the chip bubble).<city>— slash menu → Datasource field → your weather data source →name.
Train departures board
A group bound to departures (the array of next trains). Inside the group, three text layers:
- Time: slash menu → Group field →
plannedDateTime. Click the chip → presetHH:mm. - Destination: slash menu → Group field →
direction. - Platform: slash menu → Group field →
plannedTrack.
Group repeat settings: Direction vertical, Items 6, Cycle interval 10s.
Meeting room list with a page counter
A group bound to rooms, with a cycle interval so it pages through all rooms.
- Inside the group: a text layer with a Group field →
namechip. - Outside the group: a small text layer with two chips — Cycle page and Cycle total — and the static text
Page/ofaround them.
Checking it works
Pages are always live — as soon as you insert a chip, the canvas shows the real value. If something looks wrong:
- Click the chip to open the bubble menu and confirm it points where you think it does.
- Make sure you used Group field (not Datasource field) for anything that should change per row.
- Open Data Sources and check the source's last-update status. If it's failing, the chip resolves to an empty value.